| Unbiased | Original | Song | Change |
|---|
How Many Top-100 Songs per Initial Letter?
If voting were unbiased, songs would be spread roughly evenly across the alphabet. A skew toward early letters is direct evidence of primacy bias.
Alphabetical Bias
Each dot is a song. The regression line shows the estimated advantage of appearing early in the alphabet.
Average Bias per Letter
Positive = artists with this initial letter were artificially voted up.
Model Summary
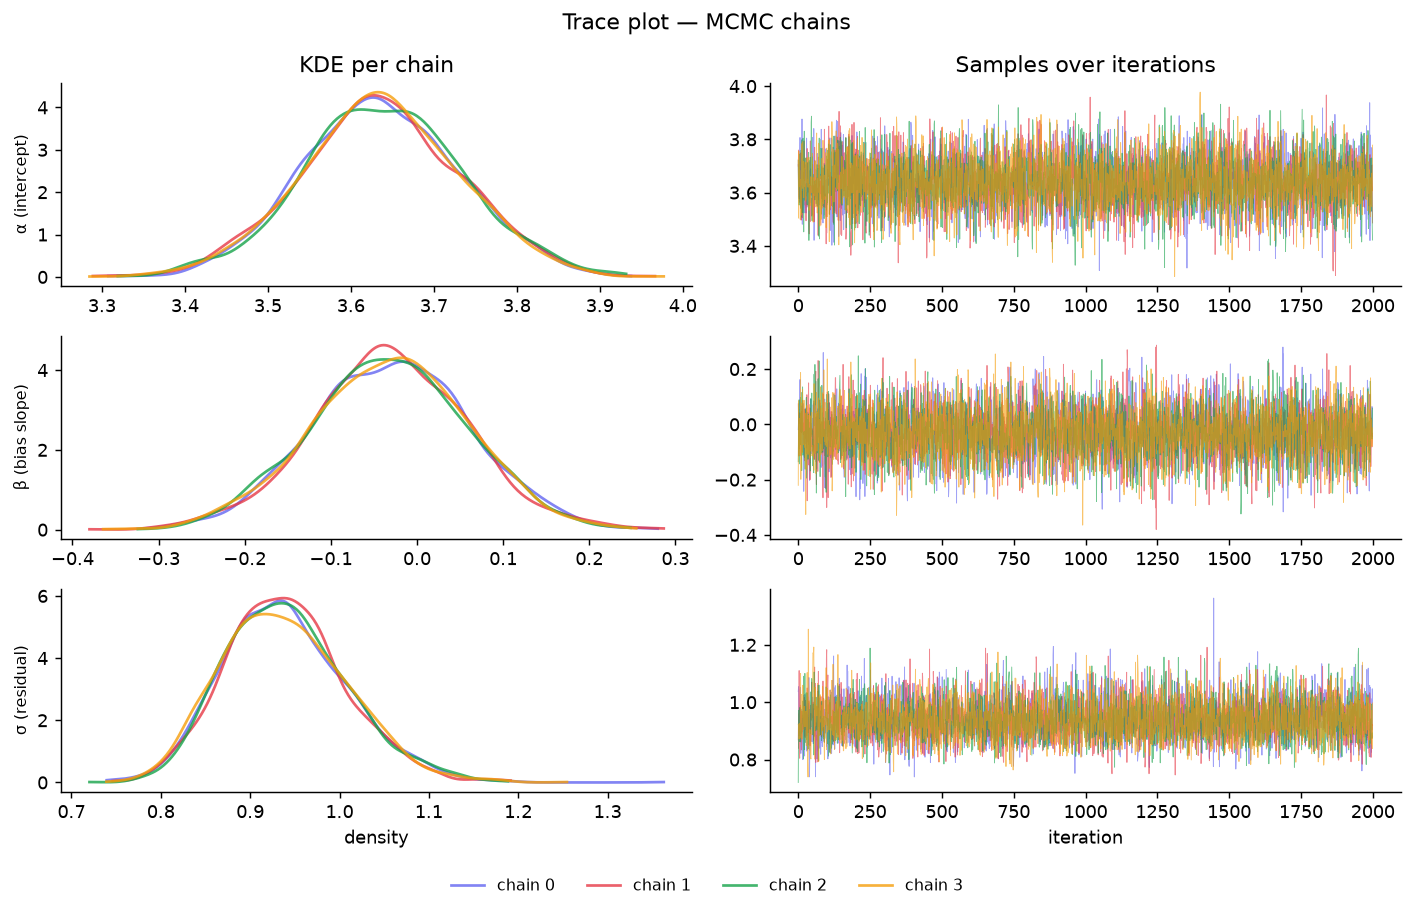
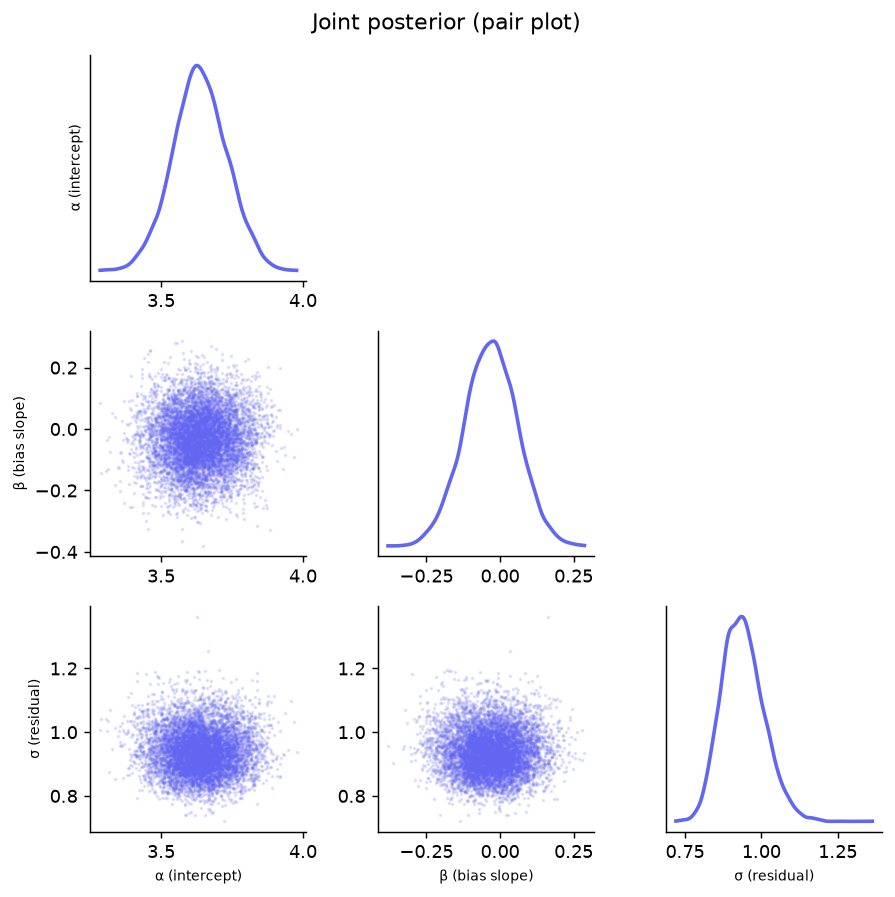
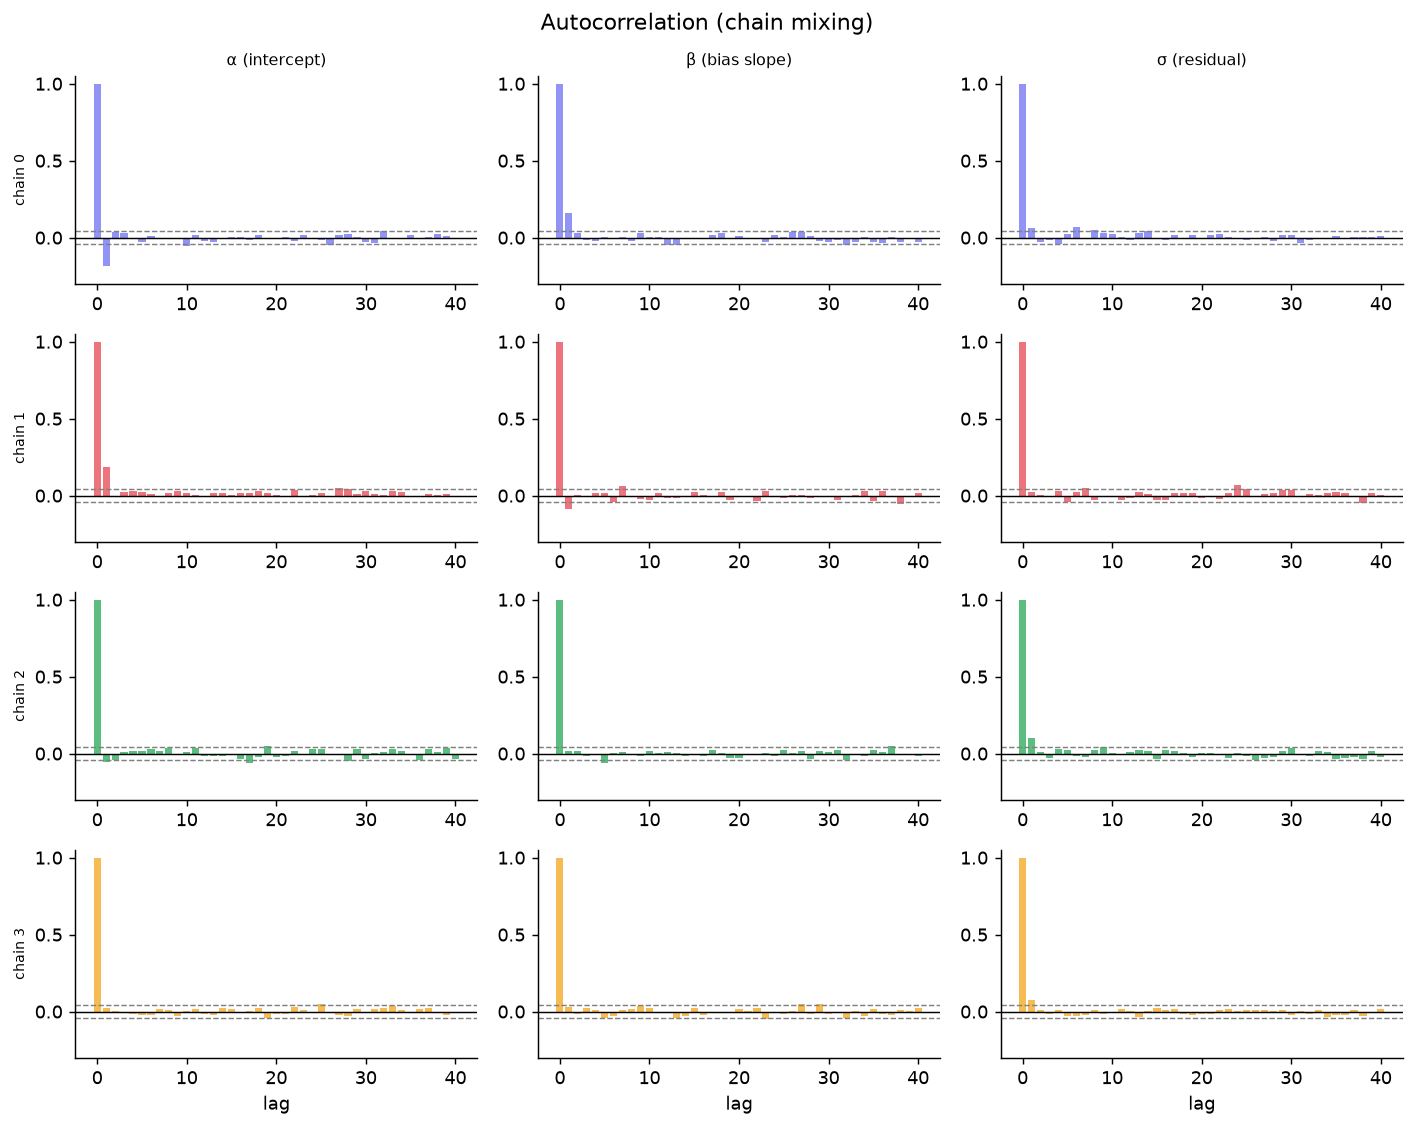
Arviz diagnostic plots generated by model.py. These confirm the sampler converged and let you inspect the posterior geometry.
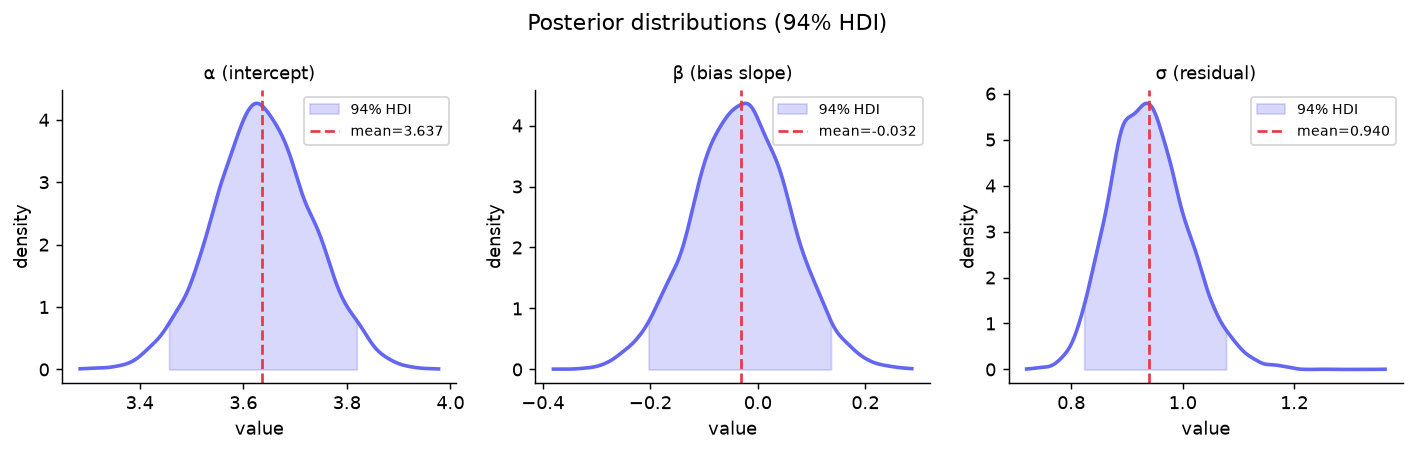
Posterior Distributions
Marginal posteriors for each parameter with 94% HDI. β captures the alphabetical bias slope.
Trace Plot
Left: KDE of each chain’s samples. Right: raw samples over iterations. Well-mixed “hairy caterpillar” chains indicate convergence.
Joint Posterior (Pair Plot)
KDE of all parameter pairs. Diagonal structure without strong correlations indicates good identifiability.
Autocorrelation
Autocorrelation by lag for each chain. Rapid decay toward zero means low correlation between consecutive samples — high effective sample size.
What is the problem?
DR's Top 100 is the result of an open vote where listeners picked up to 5 favourite songs from a long list sorted alphabetically by artist name. This is a well-known phenomenon in behavioural economics ("primacy effect" and "top-of-list bias"): options early in a list are chosen more often because they are easier to notice and recall.
The Bayesian Model
We use a simple Bayesian linear regression of log(votes) on alphabetical position — no per-song quality parameters:
log(votes_i) ~ Normal(μ_i, σ)
μ_i = α + β × pos_std_i

α ~ Normal(mean_log_votes, 1)   # global intercept
β ~ Normal(0, 0.5)              # alphabetical bias slope
σ ~ HalfNormal(1)               # residual spread (quality + noise)
Here pos_std_i is the artist’s letter position (A=1 … Å=29), standardised to mean 0 and SD 1.
A negative β means artists early in the alphabet tend to accumulate more votes on average.
σ honestly absorbs all unexplained variation — including genuine differences in song quality.
Vote Proxy
DR did not release the raw vote counts, only the final rankings.
We use a linear proxy: votes = 101 − rank, so song #1 corresponds to 100 votes and song #100 to 1 vote.
The corrected ranking subtracts the estimated alphabetical contribution from each song’s log-votes and re-ranks.
Interpretation
Songs by artists whose names start with A–C are estimated to have received the largest boost from the alphabetical list order. The corrected ranking adjusts for this average effect. Songs by late-alphabet artists (S–Å) tend to move up; early-alphabet artists (A–C) tend to move down. The effect is modest within the top 100 — the stronger signal is visible in the histogram: far more songs in the top 100 come from A–C artists than would be expected by chance.
Technical Details
- PyMC 6 — NUTS sampler, 4 chains × 2,000 draws (2,000 tune)
- Model: Bayesian linear regression of log(votes) on alphabetical position
- 3 parameters: α (intercept), β (bias slope), σ (residual spread)
- Convergence: R̂ = 1.00, ESS > 7,000 for all parameters
- Results saved to
docs/results.json